Percolation on a 2d grid graph
using EasyABMStep 1: Create Model
In this model we will work solely with the graph and won't need agents. We initially create a grid graph, and then create our model as follows.
graph = square_grid_graph(20,20);
model = create_graph_model(graph, open_nodes=Int[], percolated=false, prob=0.0)
Step 2: Initialise the model
In the initialiser! we make the node at the upper right corner of the grid graph to be open and also give it color cl"blue" to indicate presence of water at this node. All other nodes are kept closed and their color is set to cl"black".
function initialiser!(model)
    model.properties.num_nodes=length(vertices(model.graph))
    for node in vertices(model.graph)
        if node==model.properties.num_nodes #last node is open & has water
            model.graph.nodesprops[node].open=true
            model.graph.nodesprops[node].color=cl"blue"
        else #all other nodes are closed
            model.graph.nodesprops[node].open=false
            model.graph.nodesprops[node].color=cl"black"
        end
    end
    push!(model.properties.open_nodes, model.properties.num_nodes)
    model.properties.percolated=false
end

init_model!(model, initialiser= initialiser!, props_to_record = Dict("nodes"=>Set([:color])))
Step 3: Defining the step_rule! and running the model
In this step we implement the step logic of the percolation model in the step_rule! function and run the model for 50 steps. At each step of the simulation we make 10 randomly chosen nodes open and let water flow to them (i.e. assign them blue color) if connected to any source node (i.e. blue colored node).
function let_water_out!(node, model)
    water_source_nodes=[node]
    loop_condition = true
    n = model.properties.num_nodes
    while length(water_source_nodes)>0 && loop_condition
        nd = pop!(water_source_nodes)
        nbrs = neighbor_nodes(nd, model)
        for nbr in nbrs
            if (model.graph.nodesprops[nbr].open)&&(model.graph.nodesprops[nbr].color==cl"white")
                model.graph.nodesprops[nbr].color = cl"blue"
                if (nbr<=sqrt(n))
                    model.properties.percolated=true
                    model.properties.prob = length(model.properties.open_nodes)/n
                    loop_condition=false
                    break
                end
                push!(water_source_nodes, nbr)
            end
        end
    end
end

function let_water_in!(node, model)
    nbrs = neighbor_nodes(node, model)
    n=model.properties.num_nodes
    for nbr in nbrs
        if model.graph.nodesprops[nbr].open && (model.graph.nodesprops[nbr].color==cl"blue")
            model.graph.nodesprops[node].color = cl"blue"
            if (node<=sqrt(n))
                model.properties.percolated=true
                model.properties.prob = length(model.properties.open_nodes)/n
                return
            end
            break
        end
    end
end


function step_rule!(model)
    num=0
    n=model.properties.num_nodes
    percolated = model.properties.percolated
    #open 10 nodes per step
    while (num<10) && (length(model.properties.open_nodes)<n) && (!percolated)
        node = rand(1:n)
        if !(model.graph.nodesprops[node].open)
            num+=1
            model.graph.nodesprops[node].open = true
            push!(model.properties.open_nodes, node)
            if (node<=n)&&(node>=(n-sqrt(n)+1))#upper most row
                model.graph.nodesprops[node].color=cl"blue"
            else
                model.graph.nodesprops[node].color=cl"white"
                let_water_in!(node, model)
            end
            if (model.graph.nodesprops[node].color == cl"blue") && !(model.properties.percolated)
                let_water_out!(node, model)
            end
            percolated = model.properties.percolated
        end
    end
end
run_model!(model, steps = 50, step_rule = step_rule!)Step 4: Visualisation
In order to draw the model at a specific frame, say 4th, one can use draw_frame(model, frame = 4). If one wants to see the animation of the model run, it can be done as
animate_sim(model)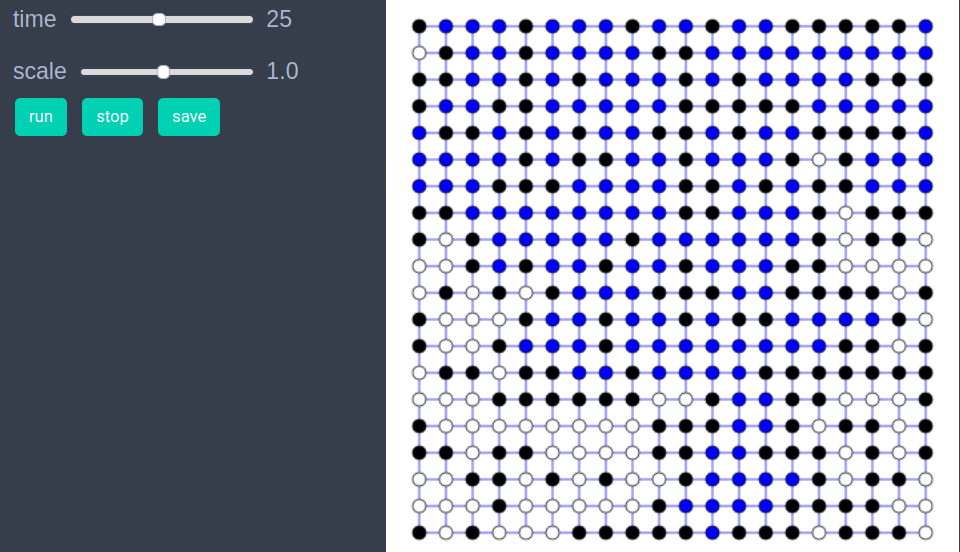
The code below calculates the average probability at which percolation occurs for an ensemble of model runs.
function calculate_percolation_probability(;grid_graph_size=20, attempts=10)
    n=grid_graph_size
    frames=Int(ceil(n^2/10)) # every step 10 random nodes are opened, so n^2/10 steps must be enough
    percolation_probs = Float64[]
    for _ in 1:attempts
        graph = square_grid_graph(n,n)
        model = create_graph_model(graph, graphics=false, open_nodes=Int[], percolated=false, prob=0.0) #don't need visualisation so set graphics=false
        init_model!(model, initialiser= initialiser!)
        run_model!(model, steps=frames, step_rule = step_rule! )
        if model.properties.percolated
            push!(percolation_probs, model.properties.prob)
        end
    end
    percolation_probs
end


probs=calculate_percolation_probability(grid_graph_size=20, attempts=80);
sum(probs)/length(probs)
0.5919687499999999
References
- https://en.wikipedia.org/wiki/Percolation_theory